Spectral Power Display
Introduction
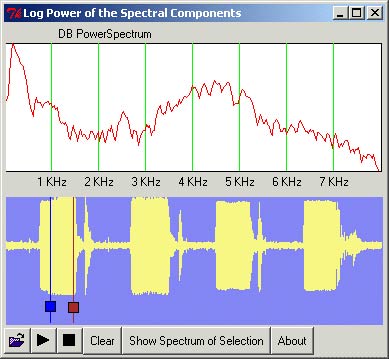
This utility is used to examine the spectral power
of a segment of speech. Above we are looking at the beet portion
of the "beetbatbootbird.wav" file. Actually, it is the ee portion of
beet, which is traditionally denoted by /i/.
The /i/ section is selected by
the red and blue veritical
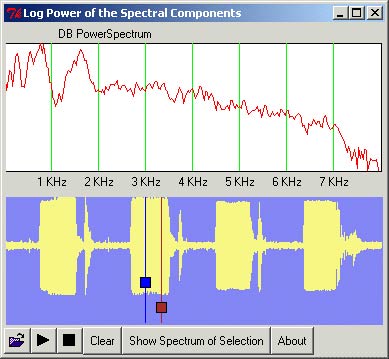
lines with boxes attached. Below we see the /ae/ selection of bat
of the same file. (The /ae/ is the traditional way of denoting the a
sound of bat)
Note that we can visually estimate the formants of the given speech
segment.
(Recall, the formants are the peaks, the first peak is f1, etc.)
For example in the above we visually estimate that
f1=300 hz and f2=2500 hz for the sound /i/
Below, for /ae/ sound we see f1=800 hz and f2=1700 hz.
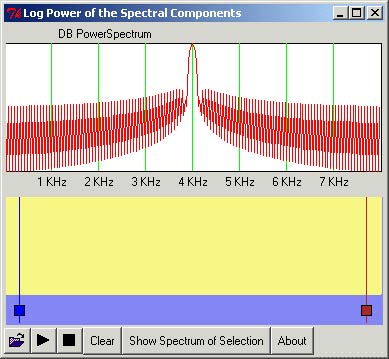
 Finally, just as a sanitity check, we feed it a sine wave at 4000 hz
which was generated by speakEasy.rb. Below is the result. (Note the lobes)
Finally, just as a sanitity check, we feed it a sine wave at 4000 hz
which was generated by speakEasy.rb. Below is the result. (Note the lobes)
Features:
- open
- play
- stop
- clear graph
- about
- show spectrum of selection